![]()

Monthly Global kNDVI using eemont and wxee
Tutorial created by **David Montero Loaiza**: GitHub | Twitter
GitHub Repo: https://github.com/davemlz/eemont
PyPI link: https://pypi.org/project/eemont/
Conda-forge: https://anaconda.org/conda-forge/eemont
Documentation: https://eemont.readthedocs.io/
More tutorials: https://github.com/davemlz/eemont/tree/master/docs/tutorials
Let’s start!
If required, please uncomment:
[1]:
#!pip install eemont
#!pip install wxee
Import the required packages.
[2]:
import ee, eemont, wxee
Authenticate and Initialize Earth Engine.
[3]:
ee.Initialize()
Use the force of eemont and wxee to get your data in an easy way!
[4]:
MOD = ee.ImageCollection("MODIS/006/MCD43A4") \
    .filterDate("2021-01-01","2022-01-01") \
    .scaleAndOffset() \
    .spectralIndices("kNDVI") \
    .wx.to_time_series() \
    .aggregate_time(frequency="month",reducer=ee.Reducer.mean()) \
    .wx.to_xarray(region = ee.Geometry.BBox(-180, -90, 180, 90))
Requesting data: 100%|██████████| 12/12 [00:17<00:00,  1.44s/it]
Downloading data: 100%|██████████| 12/12 [00:09<00:00,  1.33it/s]
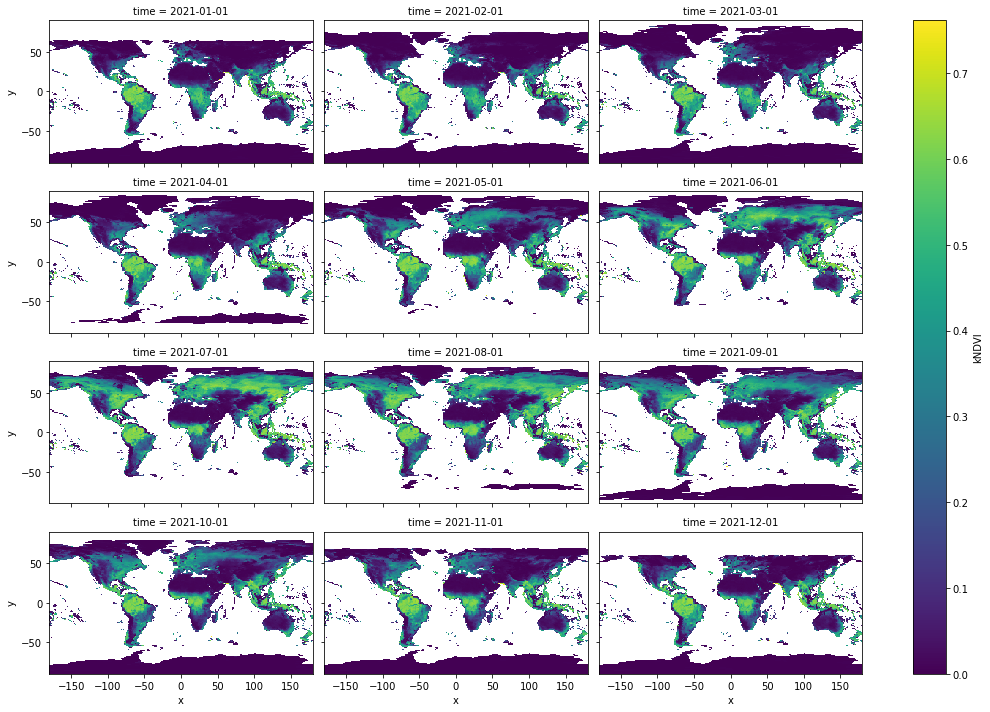
Visualize everything!
[5]:
MOD.kNDVI.plot(col="time", col_wrap=3, cmap="viridis", figsize=(15, 10))
[5]:
<xarray.plot.facetgrid.FacetGrid at 0x7f903acaee50>